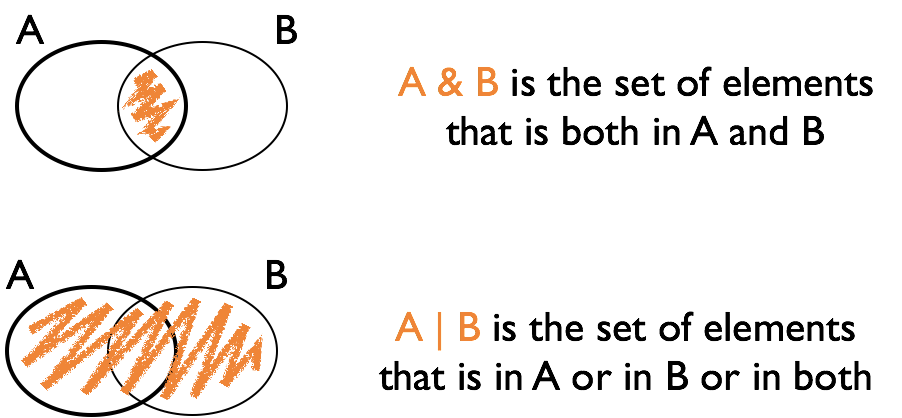
class: center, middle, inverse, title-slide .title[ # Stat 579: Logical variables and Filters ] .author[ ### Heike Hofmann ] --- ## The pipe operator `%>%` `f(x) %>% g(y)` is equivalent to `g(f(x), y)` i.e. the output of one function is used as input to the next function. This function can be the identity Consequences: - `x %>% f(y)` is the same as `f(x, y)` - statements of the form `k(h(g(f(x, y), z), u), v, w)` become `x %>% f(y) %>% g(z) %>% h(u) %>% k(v, w)` - read `%>%` as "then do" --- ## Using the pipe `%>%` ``` ggplot(data = filter(fbi, type=="homicide", aes(x = year, y = count)) + geom_point() ``` becomes ``` library(tidyverse) fbi %>% filter(type=="homicide") %>% ggplot(aes(x = year, y = count)) + geom_point() ``` --- class: inverse, center, middle # Logical variables, filters, and updating data --- ## Logical vectors - Vectors consisting of values `TRUE` and `FALSE` - Usually created with a logical comparison - `<, >, ==, !=, <=, >=` - `x %in% c(1, 4, 3, 7)` - Used in `subset` or `dplyr::filter` --- ## Combining logical expressions - `&` and `|` are the logical *and* and *or* - `!` is the logical negation - use parentheses () when linking expressions to avoid mis-interpretation --- ## Logical Operations  --- class: inverse ## Your turn Define vector `a` to be `a <- c(1, 15, 3, 20, 5, 8, 9, 10, 1, 3)` Find the expression for the logical vector that is TRUE where `a` is: - less than 20 - squared value is at least 100 or less than 10 - equals 1 or 3 - even <br> Hint: have a look at the help for the operator `%%` --- ## `filter {dplyr}` `filter` is a command of package `dplyr` `filter(data, ...)` finds subset of `data` where conditions specified by logical expression in `...` are true, e.g. - `filter(fbi, year == 2014)` - `filter(fbi, type == "larceny", state %in% c("Iowa", "Minnesota"))` multiple expressions are implicitly combined by a logical and `&` Note that the command `subset` works very similarly. Caution! there is another function called `filter` in the `stats` package. Use `::` to make sure you use the right one: `dplyr::filter` --- class: inverse ## Your turn Use the `fbi` data from the `classdata` package - Get a subset of all crimes in Iowa, Plot incidences/rates for one type of crime over time. - Get a subset of all crimes in 2009. Plot the number or rate for one type of crime by state. - Get a subset of the data that includes number of homicides for the last five years. Find the rate of homicides, extract all states that have a rate of greater than 90% of the rates across all states, and plot (Hint: `?quantile`). Extra credit (1 point): submit your code (regardless of whether it works or not) in Canvas (yourturn-checkin-1). --- ## Information extraction: useful commands Number of records in a data set: ``` nrow(dataset) ``` Quantiles: ``` quantile(variable, probs=0.001, na.rm=T) ``` Find all indices for which an expression is TRUE: ``` which(logical variable) ``` Retrieve index of maximum/minimum value: ``` which.max(variable) which.min(variable) ``` --- # Slicing a data set - the function `dplyr::slice` is a variant of `filter` that returns a subset of a dataset by position ``` slice(fbi, 1:6) # same as head(fbi) ``` - `slice_min` and `slice_max` return the record of a dataset with the smallest or largest value in a variable ``` slice_max(fbiwide, burglary) slice_max(fbiwide, burglary, prop = 0.1) # highest 10 percent ``` --- class: inverse ## Your turn Use the `fbi` data object to answer the following questions. The following question can be answered with a combination of `filter` and `slice` - Get a subset of the data that includes number of homicides for the last five years. Find the rate of homicides, extract all states that have a rate of greater than 90% of the rates across all states, and plot. --- ## Updating elements in a vector You can take a subset and update the original data: ```r a <- 1:4 a ``` ``` ## [1] 1 2 3 4 ``` ```r a[2:3] <- 0 a ``` ``` ## [1] 1 0 0 4 ``` ```r replace(a, a == 0, -1) ``` ``` ## [1] 1 -1 -1 4 ``` Very useful in combination with logical subsetting --- ## Updating elements in a data set data sets and their parts can be used as right hand side of an assignment: ```r library(classdata) # introduces new variable in the data set fbiwide fbiwide$murder.rate <- fbiwide$homicide/fbiwide$population*100000 names(fbiwide) ``` ``` ## [1] "state" "state_id" "state_abbr" ## [4] "year" "population" "violent_crime" ## [7] "homicide" "rape_legacy" "rape_revised" ## [10] "robbery" "aggravated_assault" "property_crime" ## [13] "burglary" "larceny" "motor_vehicle_theft" ## [16] "arson" "murder.rate" ``` if that variable exists before, it is being over-written/updated --- ## `mutate {dplyr}` `mutate` is a function from the `dplyr` package It allows us to introduce/upate variables in a dataset ```r fbiwide <- fbiwide %>% mutate( murder.rate = homicide/population*100000 ) ``` Allows us to focus on the WHAT, rather than the HOW.